Try Our New Metric Displays!
Trail Blazer has created an exciting new tool called "Metric Displays". It's a way for you to measure your progress over time. For example, let's say you wanted to measure your total donations this month compared to last month, or this year versus last year.
The new tool is located in the Application Menu...
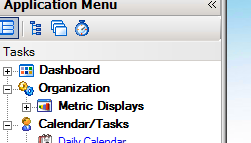
Once you click on "Metric Displays", you'll see:
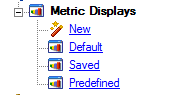
To get started, choose "New" and select the columns and the time period groups. Then you can save it for future use.
In the coming weeks, the staff at Trail Blazer will be creating some metric displays in our Predefined Folder. For now, we have just one predefined item. More to come...
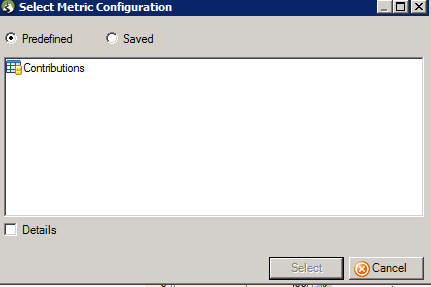
If you select Contributions, you'll see the following display format:
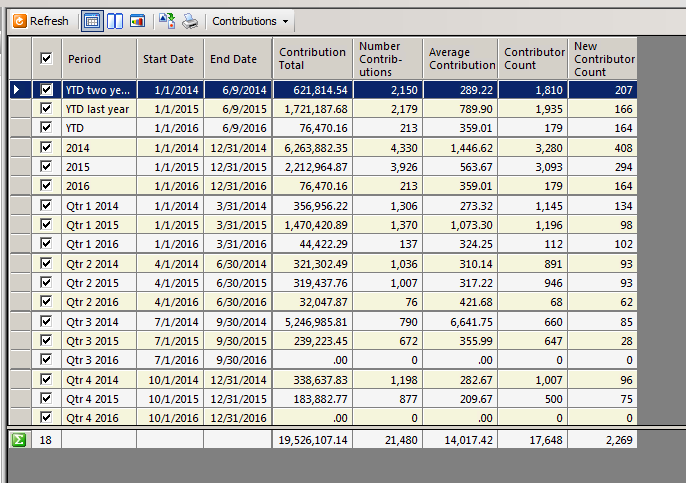
View Your Data Two Ways -- Grid or Chart
One great feature is that you can view your data in grid form or in chart form. Plus, you can display them together, side-by-side or in an over-under fashion.
Create Separate Windows for Your Data
Metric displays can be created as separate windows as we've shown here. Best of all, you can paste them on your dashboard.
Let Us Know What You'd Like to See Displayed
We currently have several metrics defined, and we expect this number to grow fast over the next several weeks. If you'd like to measure something and you don't see what you're looking for, let us know. We'd be glad to help you lay it out.
If your metric can benefit our other clients, we'll add it as an option. Even if your metric has value only to your organization, that's fine too.
In addition, we've provided the ability for our staff to define a metric on the fly without having to publish a new release. Please let us know what you want to see and we'll work to make it happen.